Fundamental Analysis for Cryptocurrencies
What is fundamental analysis? And how can you apply this to cryptocurrency trading?

With a steep correction in cryptocurrency prices recently, it’s a great time to buy coins with solid fundamentals or add to your existing holdings. But what exactly do we mean by ‘fundamentals’? What is fundamental analysis? And how can you apply this to cryptocurrency trading?
What is Fundamental Analysis?
Fundamental analysis is most often associated with the stock (or equities) market. In this case, analysts look at detailed information relating to the underlying health of a company (such as earnings, profits, sales and so on) to arrive at a fair value for the price of that company’s stock. In other words, the goal of fundamental analysis is to determine whether an asset is overvalued, undervalued or fairly priced, given the underlying fundamentals.
The field of fundamental analysis (sometimes written 'FA' for short) dates back the to early 1930s with the publication of Security Analysis by Benjamin Graham and David Dodd. The ideas used in stock markets have influenced the creation of equivalent metrics for cryptocurrencies, such as market capitalization (equal to the current price multiplied by the circulating supply), trading volume (the total quantity of shares/contracts/assets traded), liquidity, and so on.
In early 2017, interest in the use of fundamental analysis for cryptocurrencies exploded with the introduction of the Network Value to Transactions ratio (or NVT ratio for short) by cryptocurrency analyst Willy Woo. In the years that followed, other analysts built on his work, making adjustments and improvements to this indicator (such as the NVT Signal by Dimitry Kalichkin).
$BTC is not in a bubble. Here’s #bitcoin marketcap to USD volume transmitted ratio. Closest thing we have to a PE ratio. Article incoming. pic.twitter.com/OhZo9cExQV
— Willy Woo (@woonomic) February 24, 2017
The NVT ratio is analogous to the Price-to-Earnings ratio for company stock. Whenever the Price-to-Earnings ratio (or P/E ratio) is relatively high, then it suggests that the stock is overvalued. The company's earnings are too low to justify the price of the company's stock.
Similarly, if a blockchain network is only processing a historically low dollar value of transactions but the value of the network rises and rises, then the native cryptocurrency of that network is indicated to be overvalued according to analysis using the NVT ratio.
This phenomenon is illustrated with a chart for bitcoin from CoinMetrics below:
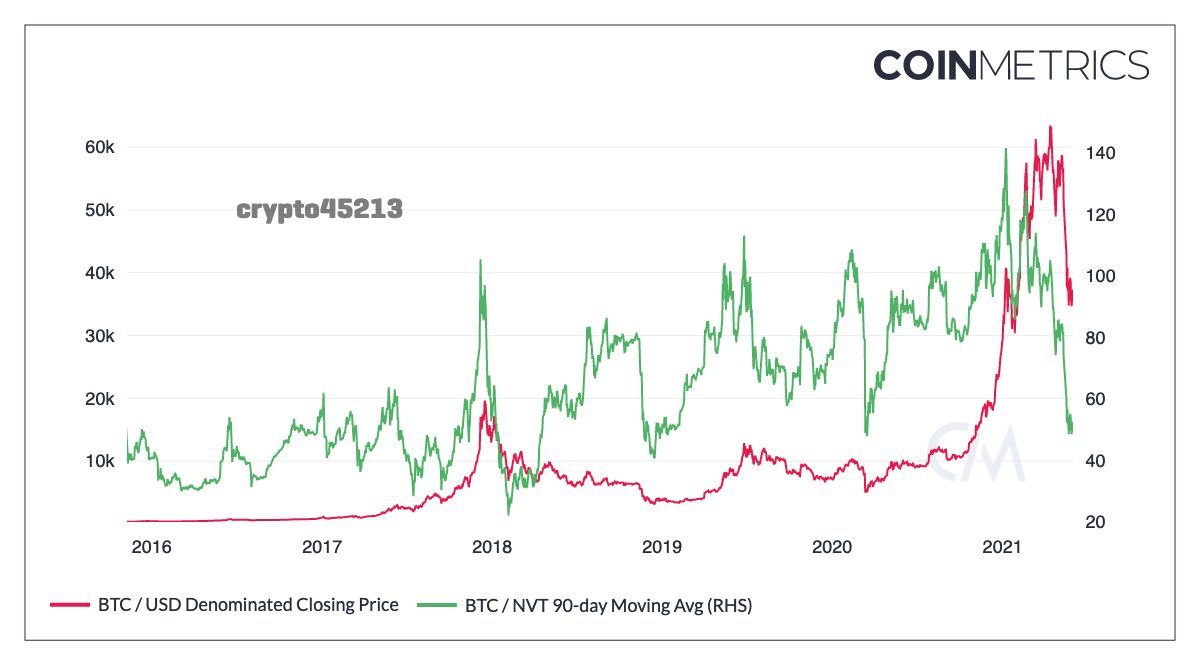
To recap, historically low values of the NVT ratio indicate that the blockchain network is undervalued while unusually high values of the NVT ratio may indicate that the network is overvalued.
Another similarity between cryptocurrencies and equities is that they are both affected by the macroeconomic environment (we'll perhaps go into more detail about this in another article!). For instance, the non-stop expansion of the fiat money supply to fight the impact of Covid on the global economy has boosted the valuations of cryptocurrencies, which mostly have a fixed supply.
Despite some indicators or methods used for cryptocurrency being influenced by the fundamental analysis of equities, there are some important differences between the two asset classes. The fundamentals of a cryptocurrency network differ greatly from valuing a company stock since cryptocurrencies are more like digital commodities.
Public Blockchains are Treasure Troves of Data
Because distributed ledgers like Bitcoin and Ethereum are publicly accessible, they provide a wealth of granular data for us to analyse (such as the transaction fees, the amount of coins/tokens held in each address, how long they were held in each address, and so on). We can easily access blockchain data and create on-chain metrics by using this data in its raw form, transforming it or combining it with other variables.
Unlike traditional markets, the playing field is levelled somewhat with this publicly accessible blockchain data which can be utilised to figure out what is really happening in the market. And as digital assets have become more accepted and gone through more maturation, analysts have created more inventive ways to determine the value of a blockchain network over the years.
While on-chain analysis goes back as far as the early years of bitcoin (with ‘Coin Days Destroyed’ being one of the first such metrics), it wasn’t until early 2017 that the field of fundamental analysis started to gain some momentum in crypto. Following the introduction of the NVT ratio as a way to analyse cryptocurrency investments, dozens of other analysts also released their own indicators based on blockchain data.
Read the original Bitcointalk post outlining the Coin Days Destroyed indicator way back in April 2011!Some of the more popular ones are: the 1-year HODL wave (which shows the percentage of the circulating supply that hasn't moved from an address in one year or more) and the Market Value to Realised Value (MVRV) ratio (which is the ratio between the market capitalisation and realised capitalisation of a crypto-asset).
The valuation of a cryptocurrency network can be divided into two parts: 1) the speculation value (the value of the cryptocurrency that is down to people holding the coin for the long term based on what they think), and 2) the utility value (which is the value provided to users who want to access a digital resource, i.e. with Bitcoin, it’s transferring value efficiently across the world with no intermediaries).
Cryptocurrencies have become more legitimised in recent years, but there’s still a lot of speculation around their value. Ideally, we want to use fundamental analysis to determine how much of the network’s value is down to speculation and how much of it can be attributed to utility the coin provides.
What are Some Examples of On-chain Metrics?
What are some examples of on-chain metrics and how can they help us to analyse a cryptocurrency's fundamentals?
On-chain metrics can be categorized into different areas, such as demand & usage, issuance, security and holder behaviour. We can also think of on-chain metrics in terms of the different players in the ecosystem: miners, developers and users.
Demand & Usage
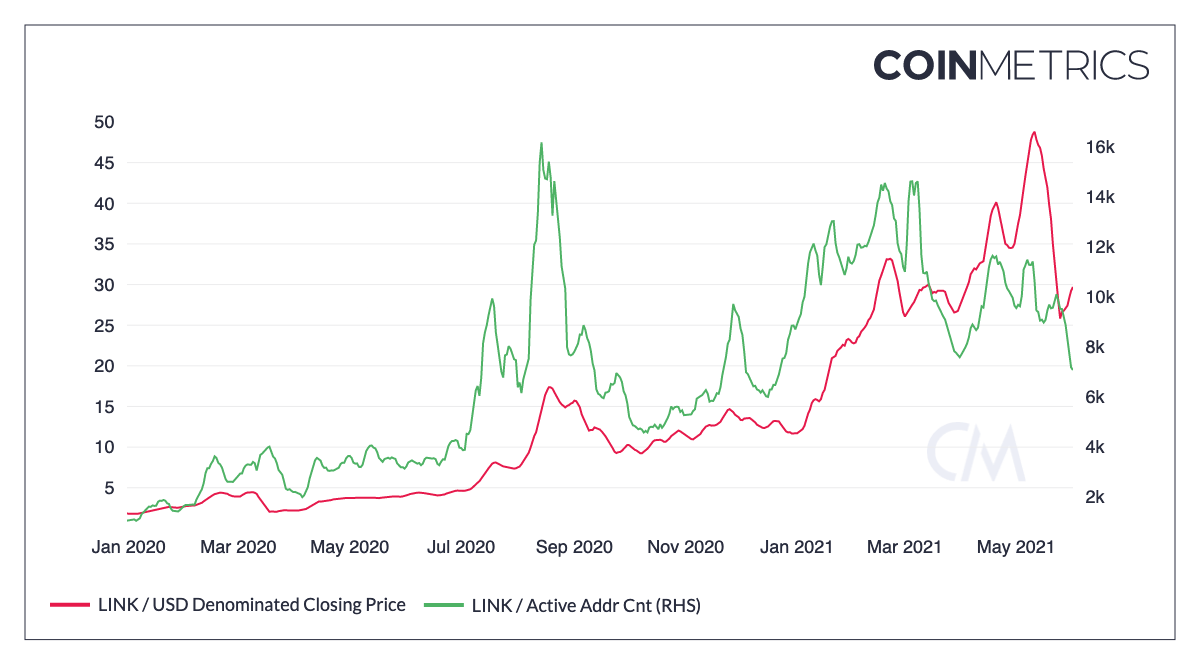
-Number of Active Addresses/Token Holders: this metric is a proxy for how many users there are. You want to see strong growth in the number of active addresses/token holders, which approximates the number of different users. If a strong 'network effect' can be achieved, then the cryptocurrency's value will rise to reflect that over time.
A good example to illustrate this is Chainlink (LINK) between January 2020 and August 2020, which went from less than 1,000 active addresses to more than 16,000 active addresses, while at the same time the price climbed from $2 to $17:
-Number of Transactions/Mean Transaction Value: the number of transactions is another indication of demand and usage. The mean transaction value is another useful indicator, as it tells us whether (on average) users are transacting larger or smaller amounts. If the mean transaction value rises over time, then it could be an indication that large players are investing in or using the cryptocurrency.
-Transaction Fees: Since with blockchains like Bitcoin, Ethereum and Dogecoin users must pay a fee for their transaction to be included into a block, the average or total fees paid to miners can provide a good indication of demand. In times of heightened demand, users need to submit higher fees to get their transaction included in the next block. Typically fees are near their highest levels as the price reaches a peak, since people are demanding block space to get their transaction confirmed so they can quickly to sell into fiat or stablecoins.
Security
-Hash Rate: For Proof-of-Work coins, you should look for a growing hash rate, which is a sign that the security of the network is improving. Coins with a declining or relatively low hash rate are more susceptible to attacks such as chain re-organizations, double spending and so on.
-Distribution of Hash Rate amongst Mining Pools: If too much hash power is concentrated amongst a handful of mining pools, then that cryptocurrency is at risk of 51% attacks - which has happened in the past with Ethereum Classic (ETC), Bitcoin Gold (BTG) and many other coins with relatively low hash rates.
-Geographical Distribution of Miners/Staking Validators: For a network to be robust to regulation or state-level attacks, the miners or staking validators must be sufficiently dispersed across the globe.
-Staking Ratio: A higher staking ratio for a Proof-of-Stake cryptocurrency means more coins are locked up and cannot be sold, reducing the circulating supply.
Supply
-Circulating Supply: How many coins or tokens are currently circulating. Typically, coins with a lower circulating supply have higher valuations relative to coins with a much higher number of circulating coins. The total supply is also important as demand will need to outweigh supply in order for the price to rise over time.
-Free Float Supply: an estimation of how many coins are circulating after accounting for lost or burned coins, a metric created and provided by CoinMetrics.
You can download data on a wide range of metrics (including the free float supply for dozens of crypto-assets via the CoinMetrics data download page.-Coin/token distribution: an important question to consider: is the coin fairly launched? (meaning there's no allocation to founders, investors and partners). And if there are allocations for founders and other groups, are they vesting for a long period of time to ensure their incentives are aligned with that of the project?
Holder Behaviour
-Miner Outflows/Reserves: To look at the market from the miner's perspective, we can use on-chain data to track their reserves and outflows from addresses associated with miners. Since miners are the natural source of selling pressure for Proof-of-Work cryptocurrencies, it can be useful to gauge their behaviour.
One useful metric is the Miner Rolling Inventory from ByteTree, which measures miner's changing inventory levels. A value above 100% means miners are selling more BTC than they mine and running down their inventory. But values below 100% mean that the miners are hoarding BTC.
-Inflows to/Outflows from Top Holder Addresses: Also known as 'whale watching', we can also look at transactions relating to addresses with a large number of coins. For exampe, a large deposit to an exchange from addresses with a large number of coins or a movement of lots of coins from an old address may often precede major price dips or advances. Or looking at addresses that have recently bought a large amount of coins or tokens could be a sign of a whale having some inside information or could precede an influx of other whales, which would push the price up.
Another thing to look at it is the number of addresses with more than 1, 10, 100, 1000 (and so on) coins, as an indication of the number of large investors involved in the project. If the number of addresses with more than a certain amount keeps rising, then it suggests that these holders think the price will rise over time.
-Bitcoin Days Destroyed/Token Age Consumed: These metrics shows the amount of BTC changing addresses daily multiplied by the number of days since they last moved. Spikes indicate a significant amount of previously idle BTC tokens moving between addresses.
For a more in-depth explanation of individual on-chain metrics, we suggest reading CoinMetrics's Bitcoin On-Chain Indicators Primer and ByteTree's paper on Network Demand Indicators.Other Notable Cryptocurrency Fundamentals
On-chain metrics are a major part of fundamental analysis, but another factor isn't as quantified, and is more like quality checklist you'll want to fill out for each project you consider investing in relating to the innovation potential of a coin.
But there are some things to take into consideration that can help you work out how innovative a crypto-asset may become:
The Whitepaper
A good whitepaper will clearly explain the mission of the project, the problems it sets out to solve and the technical details of the proposed solution. A good rule is to only invest in something where you can explain the ideas proposed in the whitepaper to your friends.
The Developer and Community Aspect
To measure the development activity of a cryptocurrency, we can use proxies such as the number of commits (and other metrics) from GitHub. Projects with more active development and successfully attract the interest of developers have a higher chance of delivering innovations that will provide value. Websites like Sanbase track the development activity of different cryptocurrencies.
Another important factor is the background of the team behind the project. Are they qualified to achieve the vision of the whitepaper? Do they have previous experience in the cryptocurrency field? Are they committed to the project? A project with anonymous developers could be viewed as a red flag, but it's not always the case.
Then there's the community aspect. Strong growth in metrics such as Reddit subscribers, Twitter followers , social chatter and so on could be used as a proxy for demand or usage. The recent social buzz around Dogecoin is a good example, it already had a strong following and provided investors with decent returns in Q1 2021.
Another important thing to consider: does the project have the backing of any companies that could improve its chances of adoption or providing an innovative feature? Adoption by large businesses or merchants is another factor that can drive the price of a coin or token higher, as it creates more awareness and adds utility value.
How the Project Fits into the Cryptocurrency Universe
Another important question to ask when investing in cryptocurrencies: what is the lineage of a cryptocurrency?
In particular, it's important to find out if the new coin or token is a fork of another project. If so, does it add anything new that will make it more valuable than the project it was cloned from? Does it fill a gap in the market or is it up against fierce competition from other projects? Do the changes made by a new project justify another coin or token to be created?
Where Can I Find Data for Fundamental Analysis of Cryptocurrencies?
One option to obtain blockchain data is to run a node and extract the data yourself, but this becomes cumbersome if you are considering multiple coins. If you don't have the resources or time to do this, another alternative is to obtain free data or pay for the data you need.
There are many websites that have sprung up and provide data relating to the health of blockchain networks, including:
- Buy Bitcoin Worldwide,
- ByteTree,
- CoinMetrics,
- CryptoQuant,
- Glassnode,
- Into The Block
- Look into Bitcoin,
- Sanbase, and
- Woobull.
Note: some of these websites require a paid membership to access all the features/indicators.
What Investment Strategies can I Utilise?
The whole purpose of fundamental analysis is to find cryptocurrencies that are undervalued and buy them (and to assess the coins you are holding, monitoring the fundamental indicators and waiting to sell until they become overvalued).
But while fundamental indicators can tell you when to buy, hold or sell, there may be long periods of time where the crypto-asset is indicated to be undervalued. In this case, you'd want to utilise some investment strategies to gain exposure to these coins during such periods.
Dollar Cost Averaging
Once you've found a project with strong fundamentals, you can gain exposure to it by dollar cost averaging (or DCA'ing).
Here’s how it works: you decide on an amount of money you’re comfortable investing (say $100) every week, fortnight or month. Then you commit to investing on a frequent basis, buying $100 of the cryptocurrency you’ve determined to have strong fundamentals, is undervalued and is therefore likely to appreciate over the long term.
No matter what the price does between each purchase, you’ll have either made some profit on your previous buy or you’ll be able to buy in at a lower price to add to your stack. As the number of purchases rack up over time, your entry price will be averaged out, hence the term dollar cost averaging.
The website dcabtc.com illustrates how this works with bitcoin, providing hypothetical examples you can customise:

One example of a dollar-cost strategy utilising fundamentals: buy into a coin frequently that is undervalued (or fairly priced) and then sell for a profit once the coin is suggested to be overvalued.
For instance, the chart below shows the MVRV Z-score for bitcoin between July 2014 and January 2018:
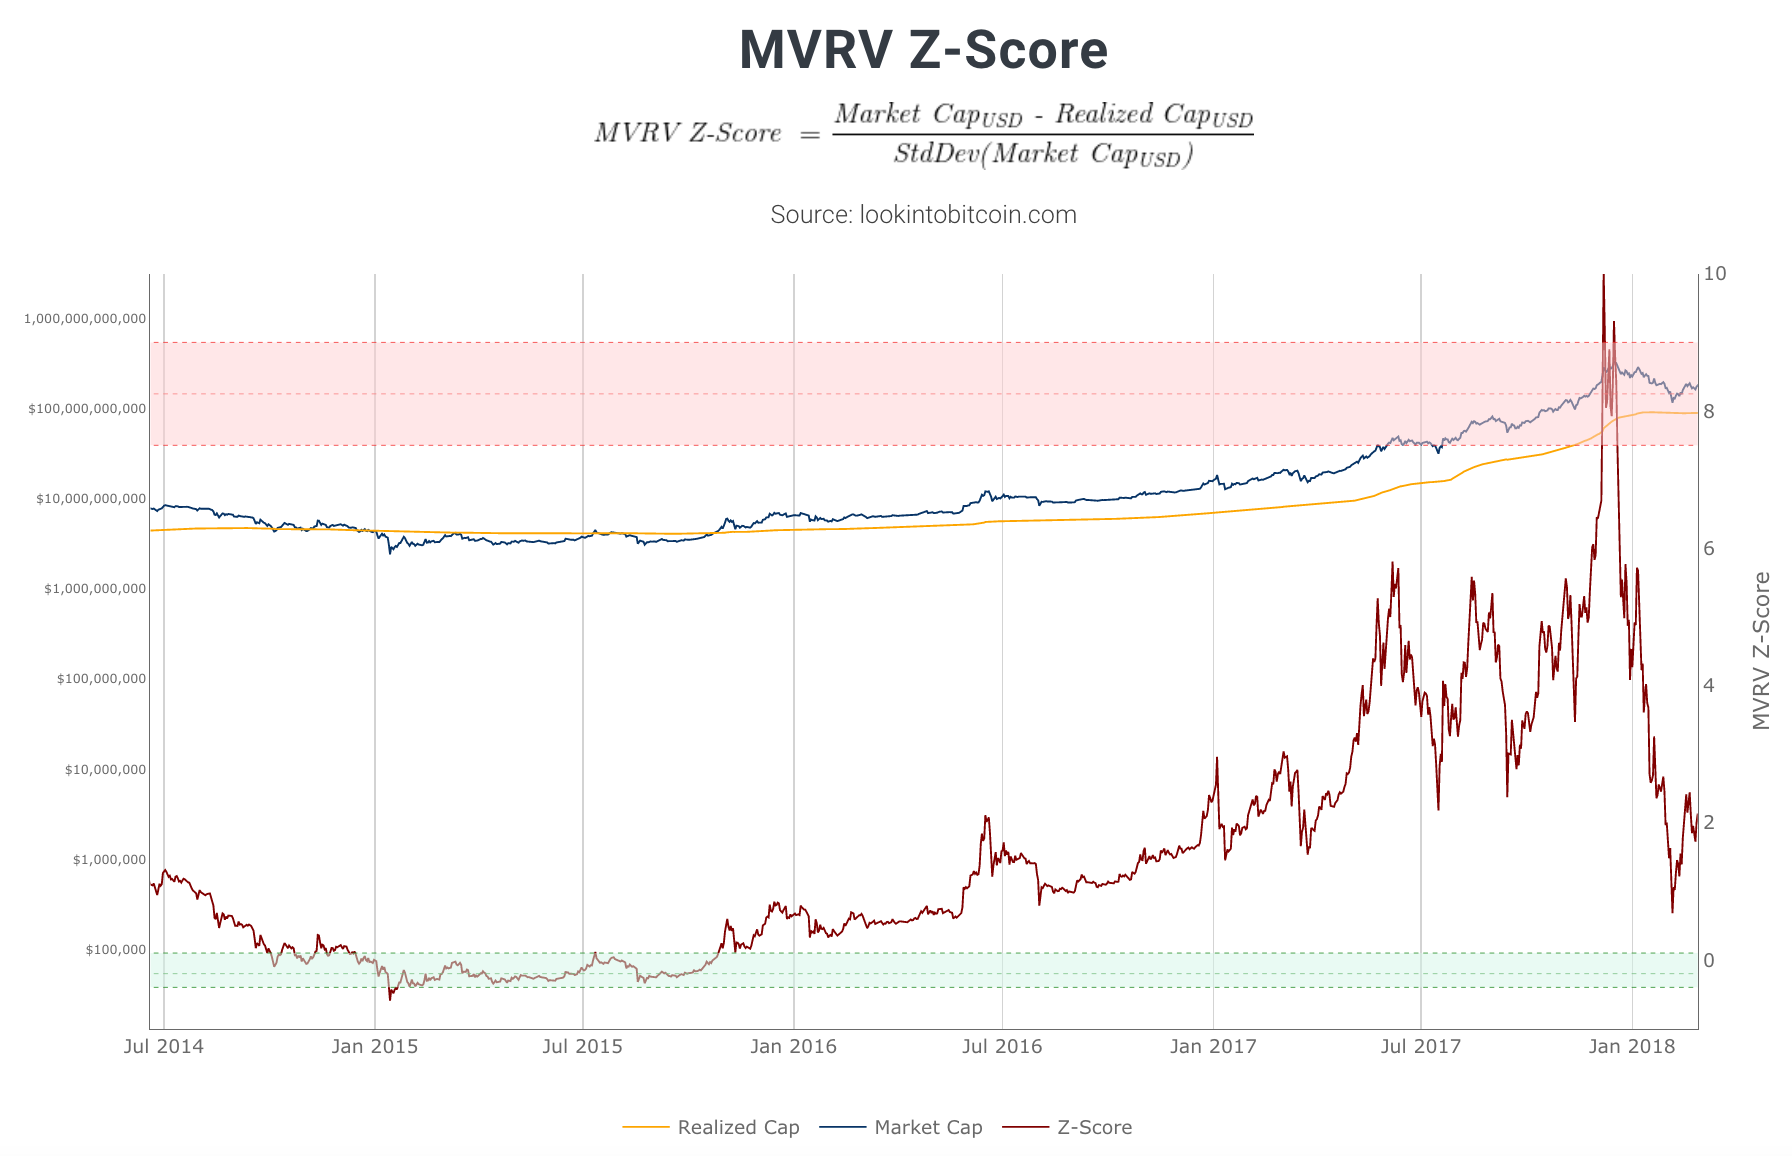
Once the MVRV Z-score (red line) reached the green zone, it suggested bitcoin was undervalued, so we would start to dollar cost average into bitcoin. We'd continue to do this until the MVRV Z-score suggests that bitcoin is overvalued (i.e., when it reaches the red zone on the chart).
Momentum Investing
The idea of momentum investing is to find and purchase cryptocurrencies that are performing well (either in terms of price performance or fundamentals) over the past week, month or quarter, as it's likely that it will continue to perform well into the future.
If a cryptocurrency has shown strong growth in a particular fundamental over the past month, then according to the momentum investing concept, we'd buy those coins in anticipation of that trend continuing. For instance, the chart below shows the cryptocurrencies with the highest recorded network growth (taken from Sanbase).
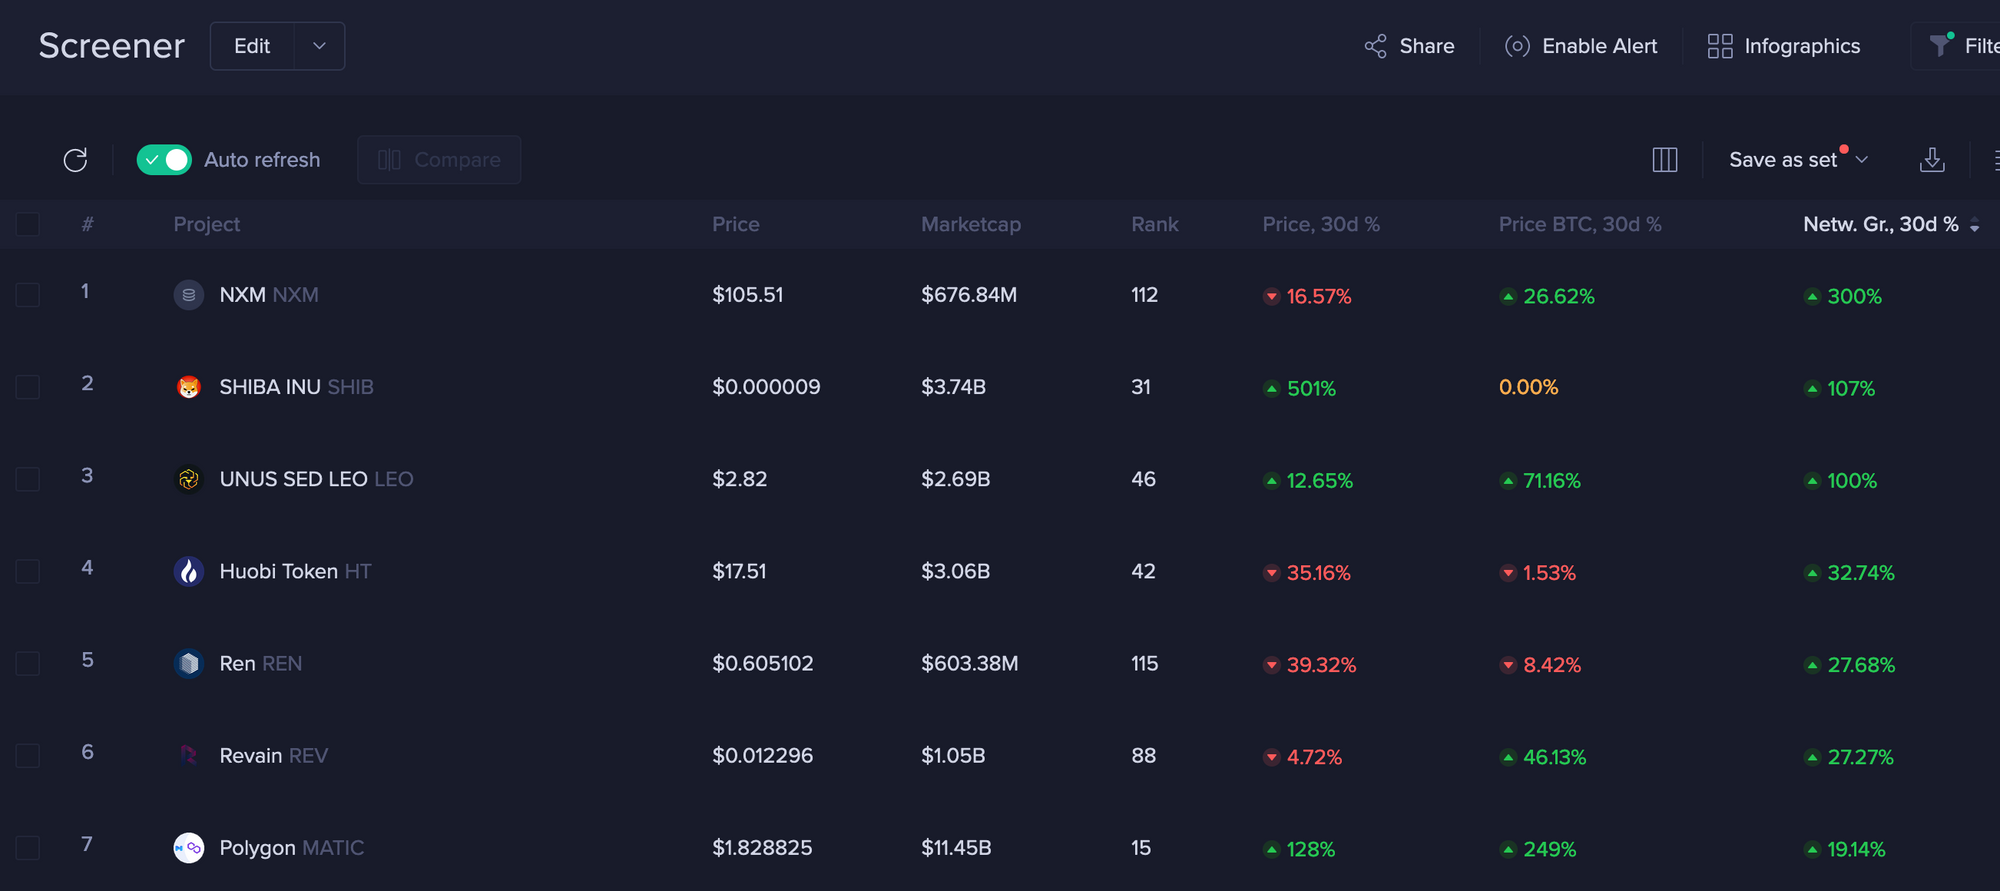
An example of a momentum strategy: buy coins with network growth higher than +10% over the past 30-days at weekly, monthly or quarterly intervals.
But as the screenshot above shows, a growing network does not always translate into a rising price. Suppose you allocated $100 to each of these 7 cryptocurrencies 30 days ago because they showed the highest network growth, then you'd currently be in profit overall (as the gains outweigh the losses in this example).
While the field of fundamental analysis dates back almost 100 years, for cryptocurrencies it's still evolving, which is what makes it so exciting and ground-breaking. Never before have analysts across the globe focused on a single asset class with such a wealth of data at their fingertips, providing a more level playing field for retail traders and investors as compared to traditional financial markets.
Please share our article on social media if you enjoyed it! Contact us via Discord or Twitter if you want us to examine a particular indicator or fundamental theme in depth!-The Rollbit Team