Sentiment Analysis for Cryptocurrencies
“Be fearful when others are greedy and greedy when others are fearful” - Warren Buffet
Understanding the psychology of the market you’re trading is important. Everyone has their own perspective, view and thoughts on why the market acts a certain way and how the market will develop in the future. The market is just a reflection of that, a collective of the thoughts and feelings of all individual traders.
News and social media play a big role in determining the market sentiment, which is the dominating emotion or idea that most traders feel best explains the current direction of an asset’s price action. Certain news stories (for example, a regulatory crackdown on bitcoin) may not greatly affect the fundamentals of a cryptocurrency like bitcoin, but it may have a large impact on the short-term price action and volatility.
If you’re long bitcoin based on sound technical analysis but then something sours the sentiment (which can happen quickly), then you need to re-evaluate your plan based on a change in sentiment.
By ignoring a shift in sentiment, you could open yourself up to an unnecessary loss. But if you’re aware of the key drivers of sentiment in the cryptocurrency markets, you’re able to minimise any losses and can adapt to sudden changes in the collective’s thoughts and feelings. That’s why if you want to trade over small timeframes, you need to be on the ball with sentiment analysis.
What is Sentiment Analysis?
As investors and traders start feeling cautious and fearful of the short-term impact of a negative news story, they may think a correction will happen and shift their outlook to bearish (which means you feel like the price will go down, whereas if you feel like the price will go up, then you're bullish).
As more and more traders become bearish, this sentiment dominates the market and manifests itself in the price action. However, it’s important to remember no single emotion can dominate or last forever. Think of your own emotions on a daily basis. You cannot stay happy or angry all the time. Instead, you generally feel a positive or negative emotion for a while, and you’ll always eventually return to ‘equilibrium’.
So in the example of a regulatory crackdown on bitcoin, eventually there will come a point where the bearish sentiment is overextended, and no longer justified, providing an opportunity for buyers to capitalise off the extreme negative sentiment. Identifying when the intensity of the bearish feeling amongst market participants is at a peak would be the aim of sentiment analysis in this case.
In such a scenario, traders using sentiment as a tool may go against the herd to buy bitcoin while bearish sentiment is at an extreme, that is before the price recovers from a severe drop, before most participants realise there was an overreaction and before the collective emotion of the market returns to equilibrium.
Everyone holds their own opinions or world views that influence how they think about a particular market. Because the market is a collection of a variety of individuals with different opinions or thoughts, these views combined are what we call market sentiment. It’s worth spending some time to figure out the sentiment of other traders (especially that of larger players who are more influential and have the potential to move the price significantly).
Market Cycles and Emotion
The Wall Street Cheat Sheet shows how different stages in a market cycle are dominated by different emotions. By examining the sentiment of other traders, you can try to assess what stage of the market cycle we are in now.
It may also be useful to look at the chart to analyse your own internal dialogue. Do you feel like selling all your possessions and going all in on bitcoin? Perhaps it’s best to counteract this feeling, as it could be a sign that the market is in the Belief or Thrill stage of the cycle shown below:

While the cheat sheet only gives a rough guide, an important thing that it also shows: how the emotions at the top of market cycle last a far shorter duration than for when the price of an asset is bottoming.
One way to trade using sentiment analysis is to find extreme highs or lows. For instance, you may have heard of the concept of a ‘crowded trade’. If everyone is buying a particular asset, the market would eventually reach a saturation point where there's no one is left to buy, since the entire crowd has done so already.
Similarly, if every analyst, commentator and everyone in your Twitter or social media feed thinks the price of bitcoin is going to rise to $100,000 in 2021, it's likely there’s a greater opportunity to sell bitcoin instead of buy, as this is one piece of evidence pointing to an extreme high in bullish sentiment.
So sentiment analysis can be used to your advantage when trading by going against the crowd when the market's psychology is in an extreme state. We can also use sentiment analysis to go with the crowd, buying a coin that is experiencing growth in positive sentiment. Another method is to find out the sentiment of bigger players, who trade or invest at a high, professional level or who have made correct predictions in the past about the behaviour of an asset.
What are the Best Tools for Gauging Cryptocurrency Market Sentiment?
There’s no easy way to measure how all the market participants are feeling individually. But there are some tools that attempt to uncover the sentiment of the cryptocurrency market, and may help to improve your trading performance and techniques.
Crypto Fear and Greed Index
The Crypto Fear and Greed Index is a cryptocurrency take on CNNMoney's fear and greed index, which measures the two primary emotions that drive the willingness of investors to buy or sell stocks. The idea is that excessive fear in the market depresses stock prices while too much greed inflates valuations.
Alternative.me applied this concept to the cryptocurrency market to create a metric that can be used to analyse if the market is fairly priced or not.
When the market is performing well, people display a fear of missing out (also known as 'FOMO') which stretches market valuations. In contrast, during slumps in the cryptocurrency market, many people are tempted to sell, so coins tend to be undervalued.
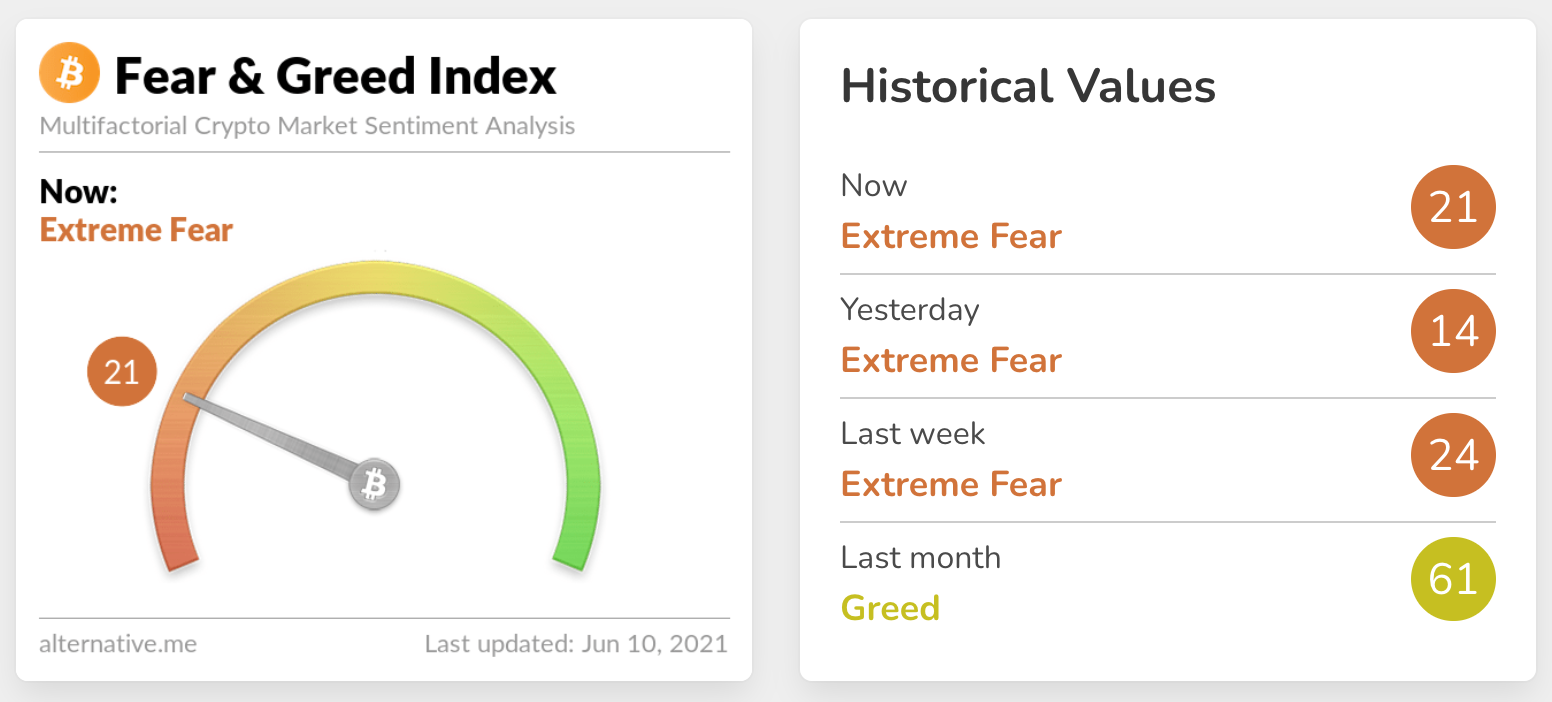
To stay on top of sentiment, monitor the Crypto Fear and Greed Index to get an idea of the current state of the market. You can also search for trading setups when there are extreme readings, such as when the cryptocurrency market is experiencing Extreme Greed (find an opportunity to sell) or Extreme Fear (find a good opportunity to buy).
Let's look at an example: buying bitcoin on the daily close when the Crypto Fear and Greed Index hit a low of 8 on March 14, 2020 produced an enormous return of +684% to date.
At the other end of the spectrum, on April 14 and April 18 2021, the Index reached a high reading of 79, indicating extreme greed, while bitcoin posted an all-time high above $64,000 inbetween these two readings.
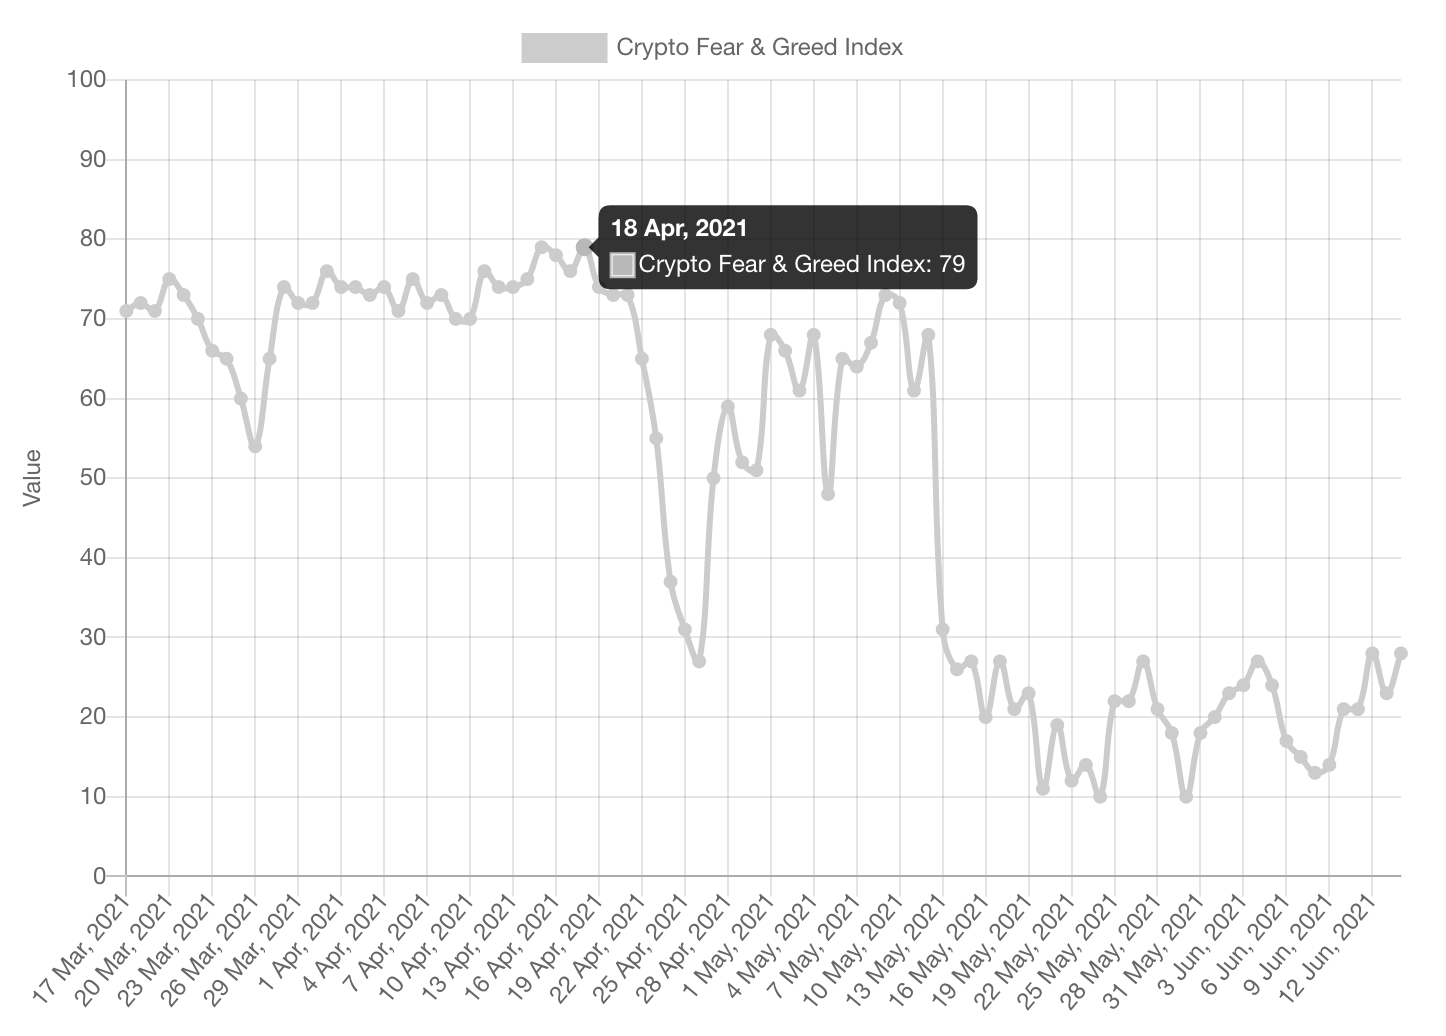
The price of bitcoin then fell to lows of around $47,000 in the following two weeks. The Crypto Fear and Greed Index then posted a low of 27 (indicating extreme fear) just one day after the bottom for that move was established around $47,000 on April 25, 2021, which provided an opportunity to buy and the price returned to the $59,000 level by early May.
Check out the Crypto Fear and Greed index for yourself here.Sanbase
The cryptocurrency analytics platform Sanbase has several features that can help you with sentiment analysis of different cryptocurrencies:
- The Social Trends tool allows you to explore the social volume of any word or phrase on social media to see what's trending and influencing market participants in the cryptocurrency market in real-time.
- The Screener tool allows you to create your own screener, where you can filter by various factors (such as market capitalisation, volume, social volume) and order cryptocurrencies from best to worst for indicators like 1-day, 1-week or 30-day change in social volume.
- Positive Sentiment: you can choose to view the total positive sentiment or by social media channel (Twitter, Telegram or Reddit).
- Negative Sentiment: you can choose to view the total negative sentiment or by social media channel (Twitter, Telegram or Reddit).
- Average Sentiment: the difference between positive sentiment and negative sentiment.
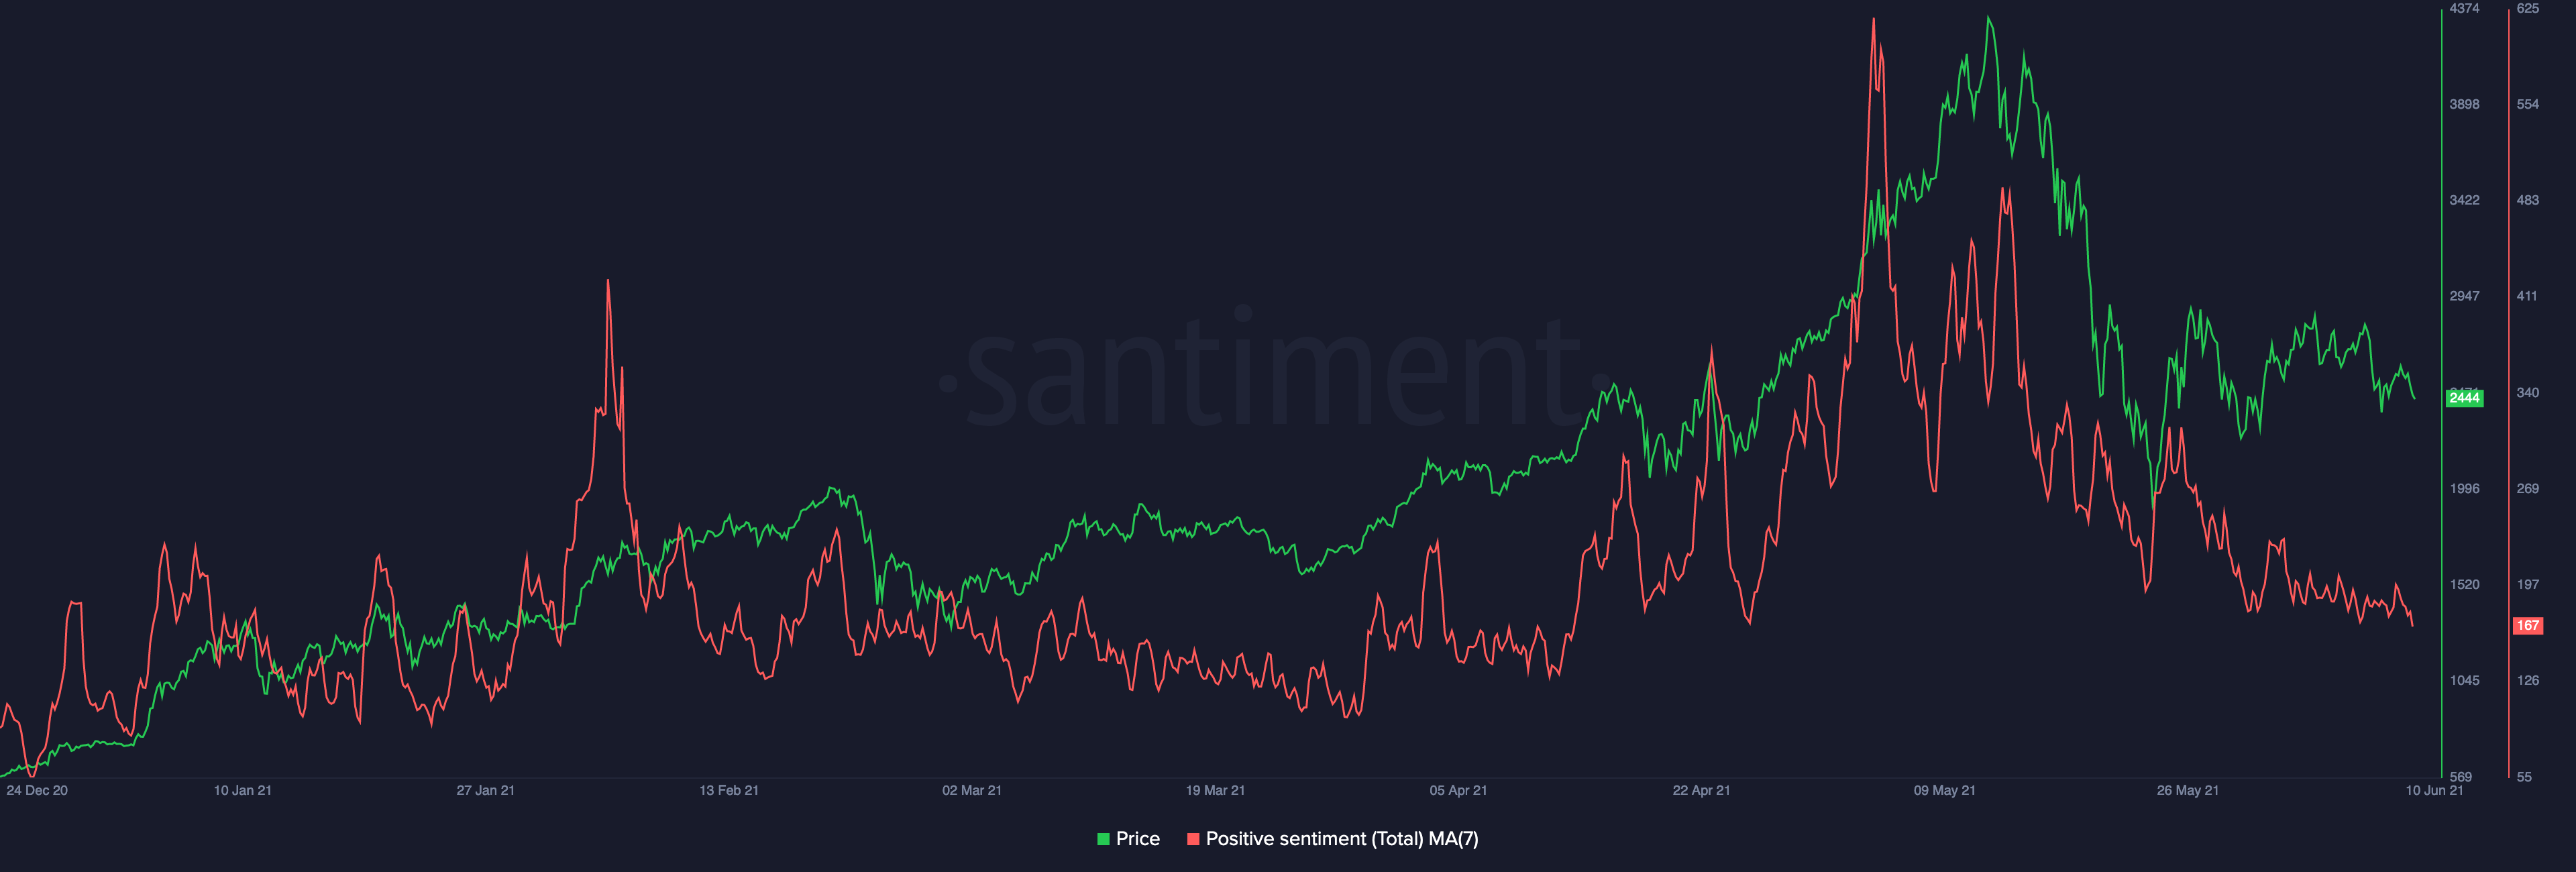
As the chart below shows, many of the peaks and troughs in the 7-day moving average of the positive sentiment for Ethereum have previously aligned with turning points in the price action of ETH since early 2021:
LunarCrush
LunarCrush is a platform dedicated to 'social listening', providing a wealth of data on the social activity related to different cryptocurrencies. The features useful for sentiment analysis are listed below:
- Galaxy Score: LunarCrush's proprietary metric combines four indicators including a price score, social sentiment, social impact and a correlation rank. The correlation rank determines how closely the social data is linked to the coin's price and volume. Consider buying coins that display steady growth in the Galaxy Score over time.
- AltRank: The AltRank was designed to measure the traction of a cryptocurrency project, accounting for social interactions, news articles, and so on. If a coin is consistently ranking high, then it could be a sign of improving sentiment in the future as the community becomes larger.
- Markets Dashboard: Assess sentiment regarding the cryptocurrency market as a whole with a breakdown of the growth in total social volume, total social engagement, total shared links, a social sentiment score and more.
- Social Feeds: Another useful feature on LunarCrush that can help you with sentiment analysis are the social feeds, where you can: i) view the social media accounts related to cryptocurrency that are the most influential (or get the most engagement) over various timeframes, ii) view the most influential tweets, social media posts, YouTube videos, or shared links, and iii) view trending posts in real time so you can get the latest market updates.
- Alerts: you can set alerts for particular coins that trigger when there's been an increase/decrease in various metrics such as social volume, social engagement, traded volume, number of tweets and more on an hourly or daily basis. The Alerts Preview can even help you build a purely sentiment based trading strategy with these alerts, as LunarCrush also includes the historical performance of trading on the customised signals you create. Alerts can be sent via the website itself, via email or by Telegram.
For example, we've created an alert to trigger if the social volume for bitcoin increases +5% on the previous day. The Alert Preview shows us that over the past year, the return on this strategy would've been roughly +53% with an alert provided every 3 days on average. You can experiment with the parameters and find a strategy based on sentiment. Of course, it's worth keeping in mind that historical performance is not a guide to the future.
Use the History tab (shown above) to see the average percentage gain for 1 hour, 1 day and 1 week after your customised alert was triggered. For our example, there's an average gain of +1.54% in the following day and +3.32% in the following week after the alert is triggered.
Get an account and add alerts on LunarCrush to see detailed information related to the sentiment of different cryptocurrencies.If you enjoyed our article on sentiment analysis or found it useful, please share it on social media. Are there any particular metrics or topics related to cryptocurrency trading you'd like to read about? Let us know via Discord or via Twitter!-The Rollbit Team