The Crypto Pulse November 30th
Rollbit's weekly analysis and review of the news in Bitcoin, Ethereum, NFTs and cryptocurrency markets.

Rollbit's weekly analysis and review of the news in Bitcoin, Ethereum, NFTs and cryptocurrency markets.
News 📰
Bitcoin Slips to $55K as Renewed COVID Concerns Jolt Traditional Markets
Last week saw Bitcoin slip to the lowest levels since early October as concerns about a new strain of Covid weighed on the markets and saw risk-on assets (such as cryptos) suffer. BTC-USD reached a low of $53,524 on November 26th, following news of the Omicron variant, fresh lockdowns and new restrictions in many countries. Since November 26th's low, Bitcoin has regained some of its losses and is currently trading near $57,400.
More than 1 Million ETH has been Burned Following EIP-1559
The Ethereum network has burned 1 million ETH in 110 days following the London hard fork, also known as EIP-1559. In August, the London upgrade saw the Ethereum network start splitting transaction fees in two: a base cost which is burned and a priority fee, which serves as a form of payment to miners.
The net emission of ETH has declined significantly since the upgrade, as shown by the chart below. The milestone of 1 million ETH burned was accompanied by Ether rising to the highest price against Bitcoin since August.
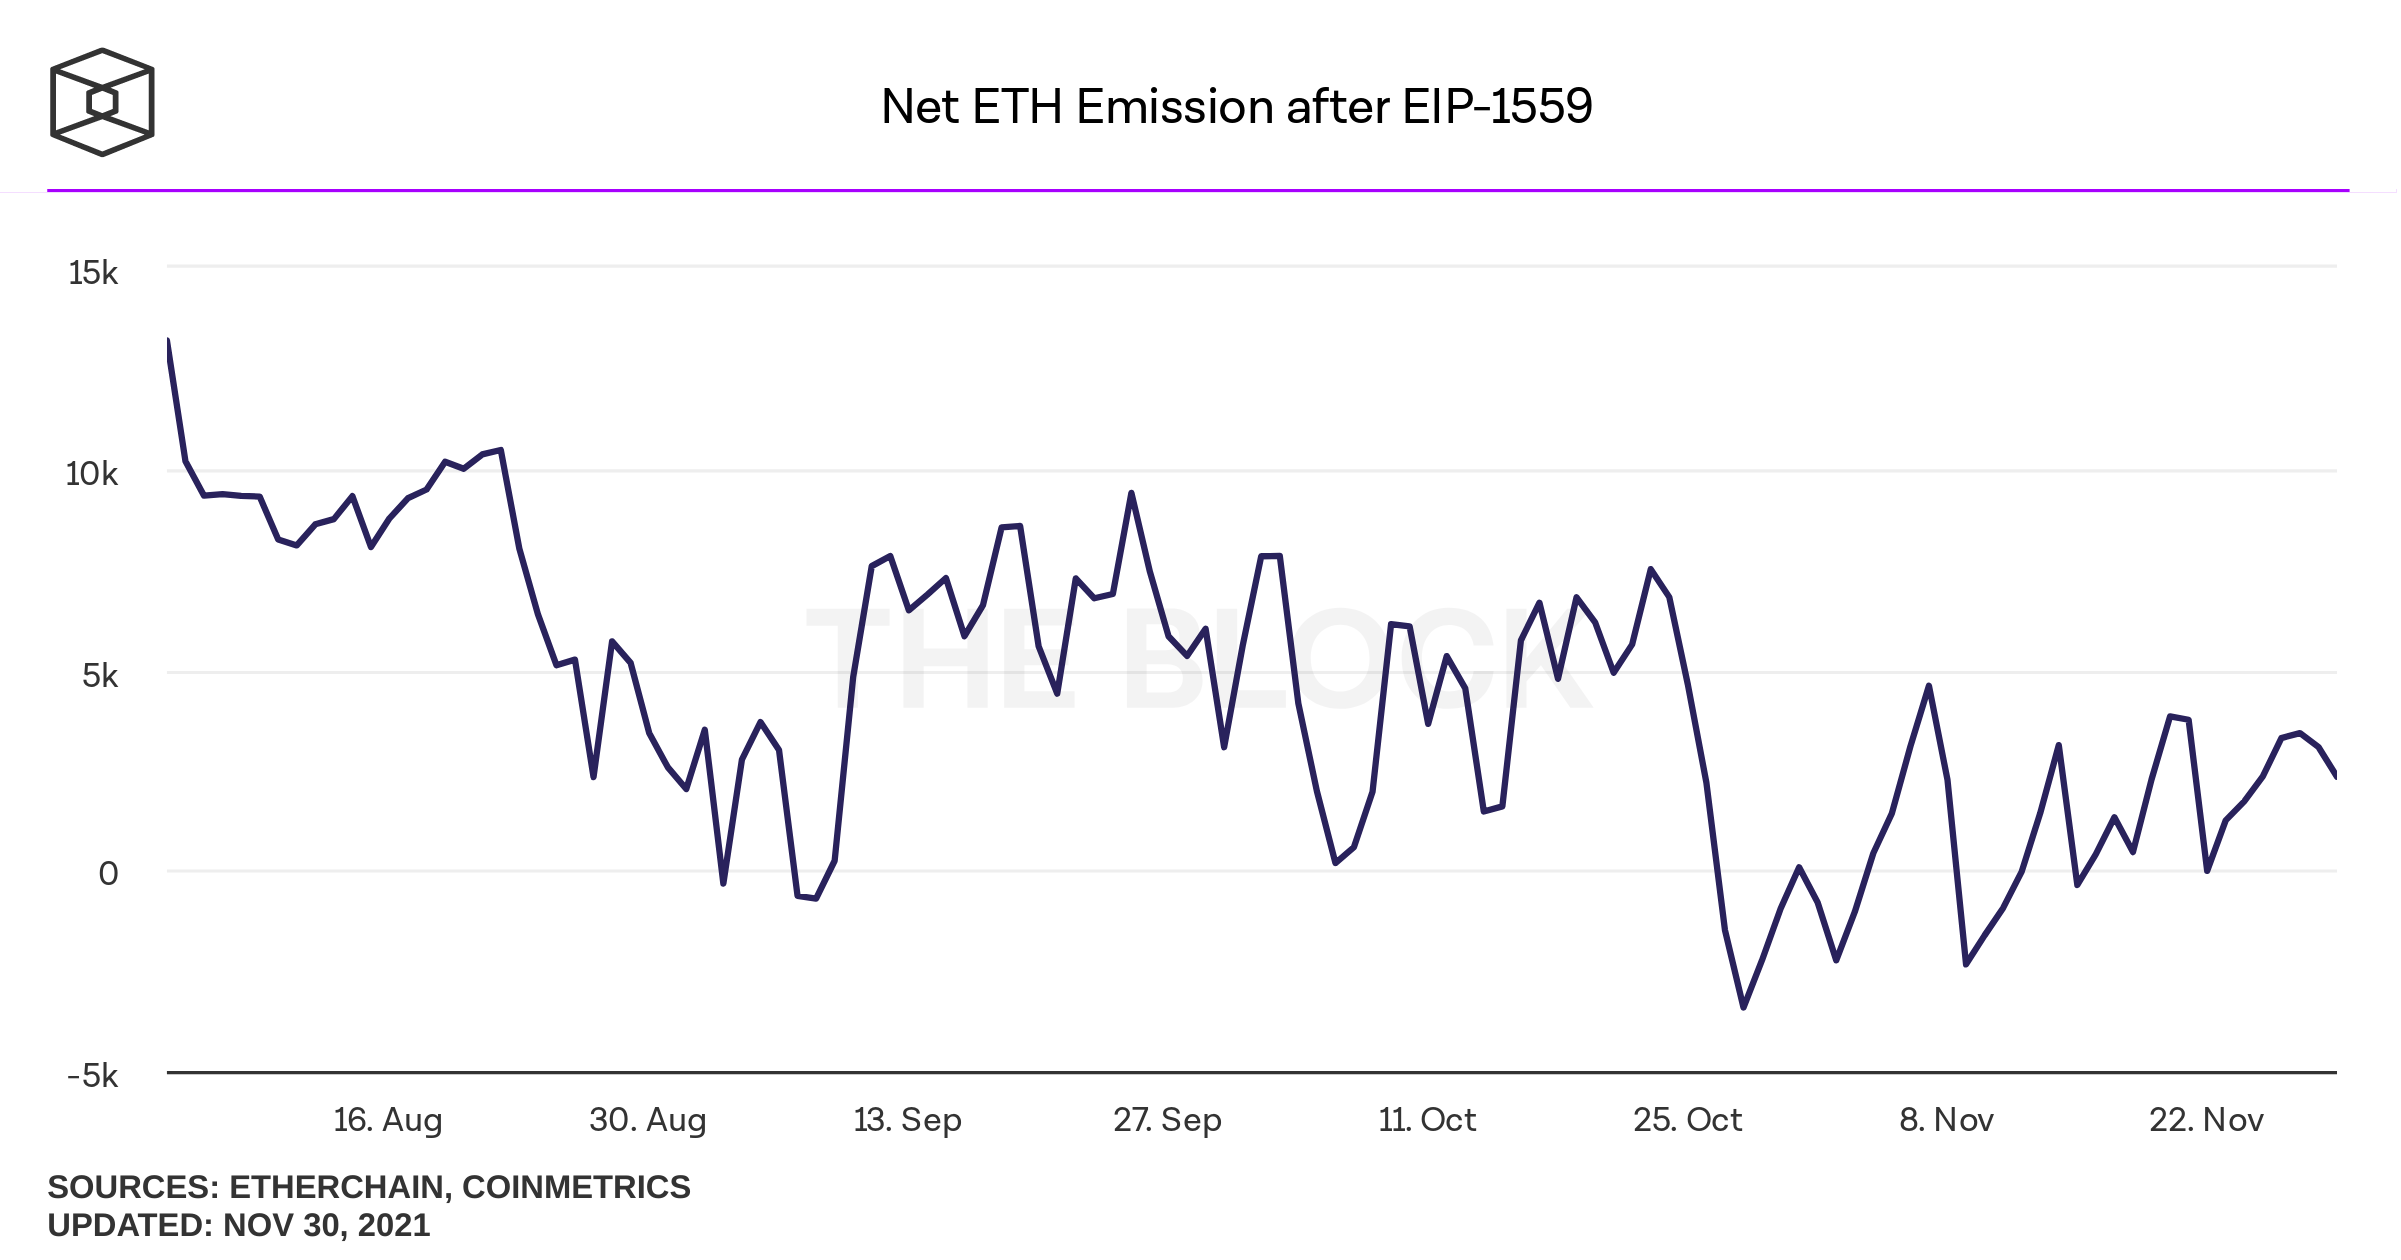
Source: The Block Data Dashboard
Morgan Stanley Funds Adding to Bitcoin Exposure, SEC Filings Show
According to new filings with the U.S. Securities and Exchange Commission (SEC), some of the funds managed by Morgan Stanley added exposure to Bitcoin in Q3. For example, Morgan Stanley's Growth Portfolio Fund added 1.5 million shares of the Grayscale Bitcoin Trust and its Insight Fund added nearly 600,000 shares over the same period.
In new SEC filings, Morgan Stanley has disclosed a dramatic increase in Bitcoin exposure in its asset management business.
— MacroScope (@MacroScope17) November 24, 2021
Earlier this year, Morgan reported buying Grayscale BTC in a large number of investment funds. For the three funds with the largest Grayscale holdings...
‘NFT’ Named Top Word of the Year by the Dictionary Publisher Collins
The dictionary publisher Collins named NFT or non-fungible token as the top word for 2021. On their blog, the publisher described the phenomenon as an intersection between internet and money, “It’s certainly a buzzword we’ve heard over and over again in the past 12 months, in breathless news reports and on social media.”
Interest in NFTs exploded in 2021, with transaction volume grew steadily since January and reaching a record high of $1.05 billion in August. Along with NFTs, Collins also named 'crypto' and 'metaverse' as their top words for the year.
‘Axie Infinity Land Plot Sells For Record $2.48 Million
An “extremely rare” piece of virtual land in the crypto game Axie Infinity was sold for 550 ETH on November 24th, more than $2.48 million and the largest ever sale to date. There are only 220 "Genesis" plots in existence, making these land parcels one of the rarest in the game.
Yesterday, an Axie Genesis Plot sold for 550 ETH!
— Axie Infinity🦇🔊 (@AxieInfinity) November 25, 2021
This was the largest sale ever for a single plot of digital land ✨🔥
Learn about Land 👇https://t.co/6zPh0roPqG pic.twitter.com/4h5yERCwwO
Other News
- MicroStrategy's Bitcoin stake has doubled in value to $7 billion,
- Blockchain gaming guild Avocado raises $18 million from Solana Ventures and others,
- Audius, a music streaming platform based on Solana, launched a new feaure that allows users to embed NFTs on blogs and social media platforms like Discord and Twitter,
- The Avalanche network reached a major milestone: 1 million wallets in total,
- This week's staking rewards for Rollbit's NFT marketplace can be claimed on Thursday, December 2nd at 19:00 UTC!
Market Analysis 📈📉
7-day Price Change
- BTC: +2.1%
- ETH: +13.6%
- BNB: +11.6%
- SOL: -1.7%
- ADA: -12.0%
- XRP: -3.0%
- DOT: -2.6%
- DOGE: -2.0%
- SHIB: +22.4%
- LTC: +0.2%
- MATIC: +16.6%
- LINK: -3.5%
- TRX: -4.8%
Data as of November 30th, 21:30 UTC
Let's look at the Bitcoin chart.
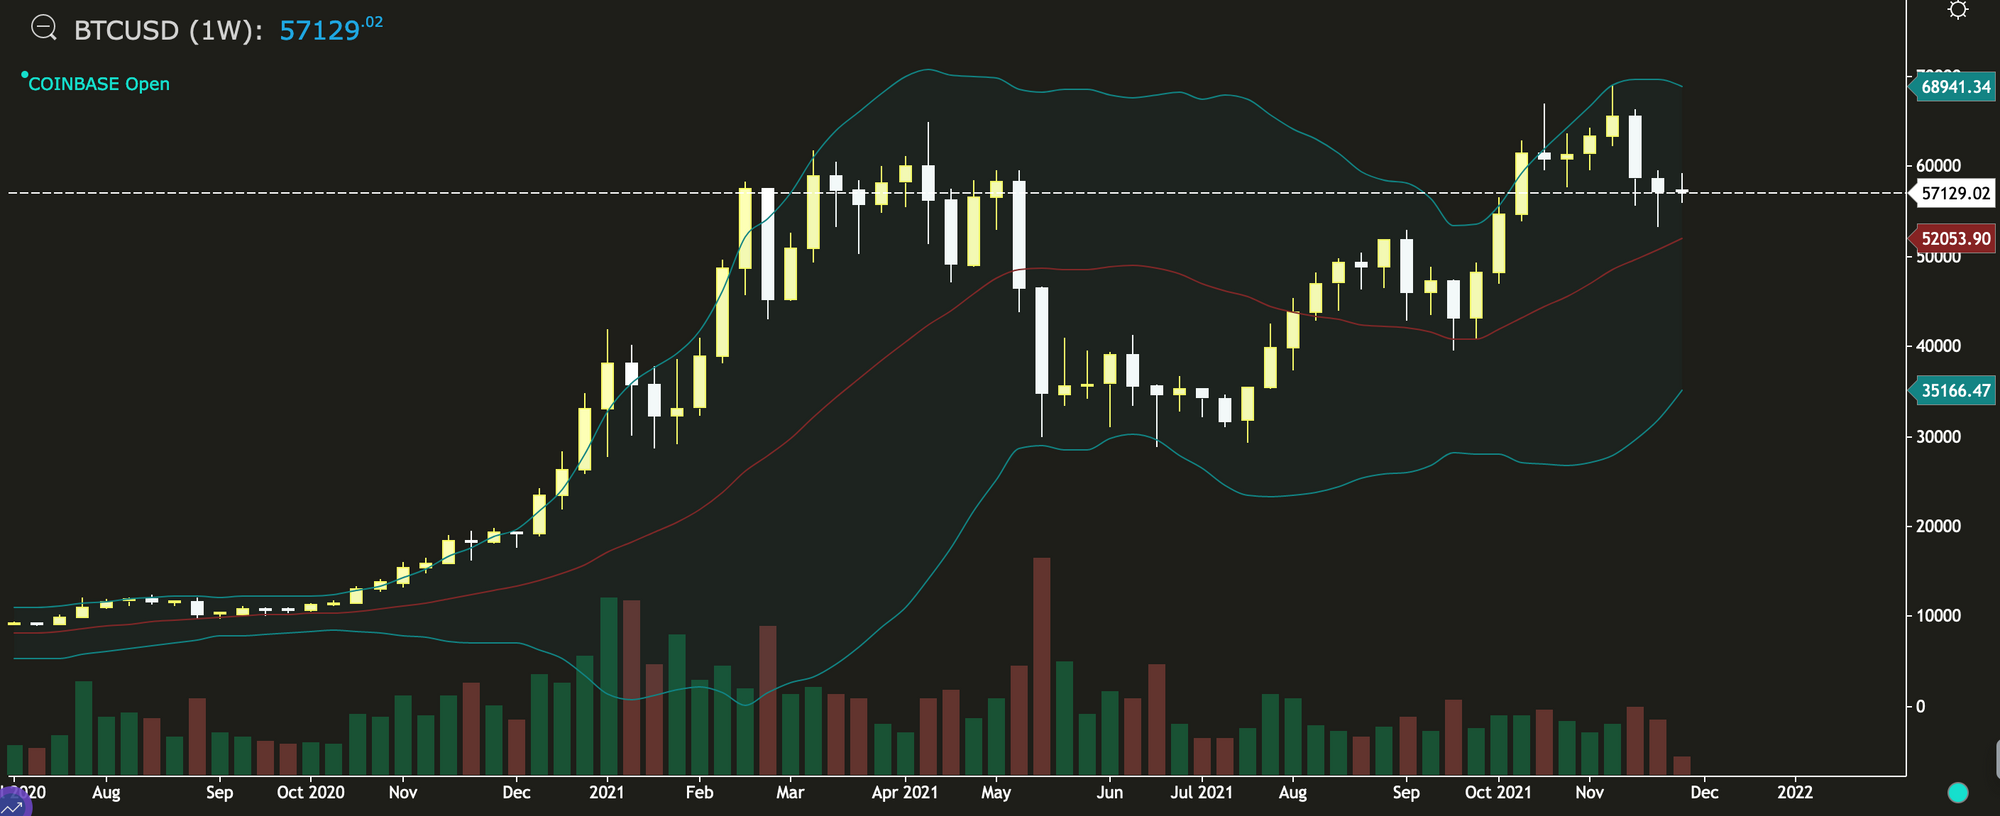
Bitcoin has seen two consecutive weeks of losses and the chart above shows that the middle Bollinger band just above $52,000 should provide support going forward. Last week's price action saw a movement towards the middle band, but buyers managed to push higher to bring the weekly close to $57,317.
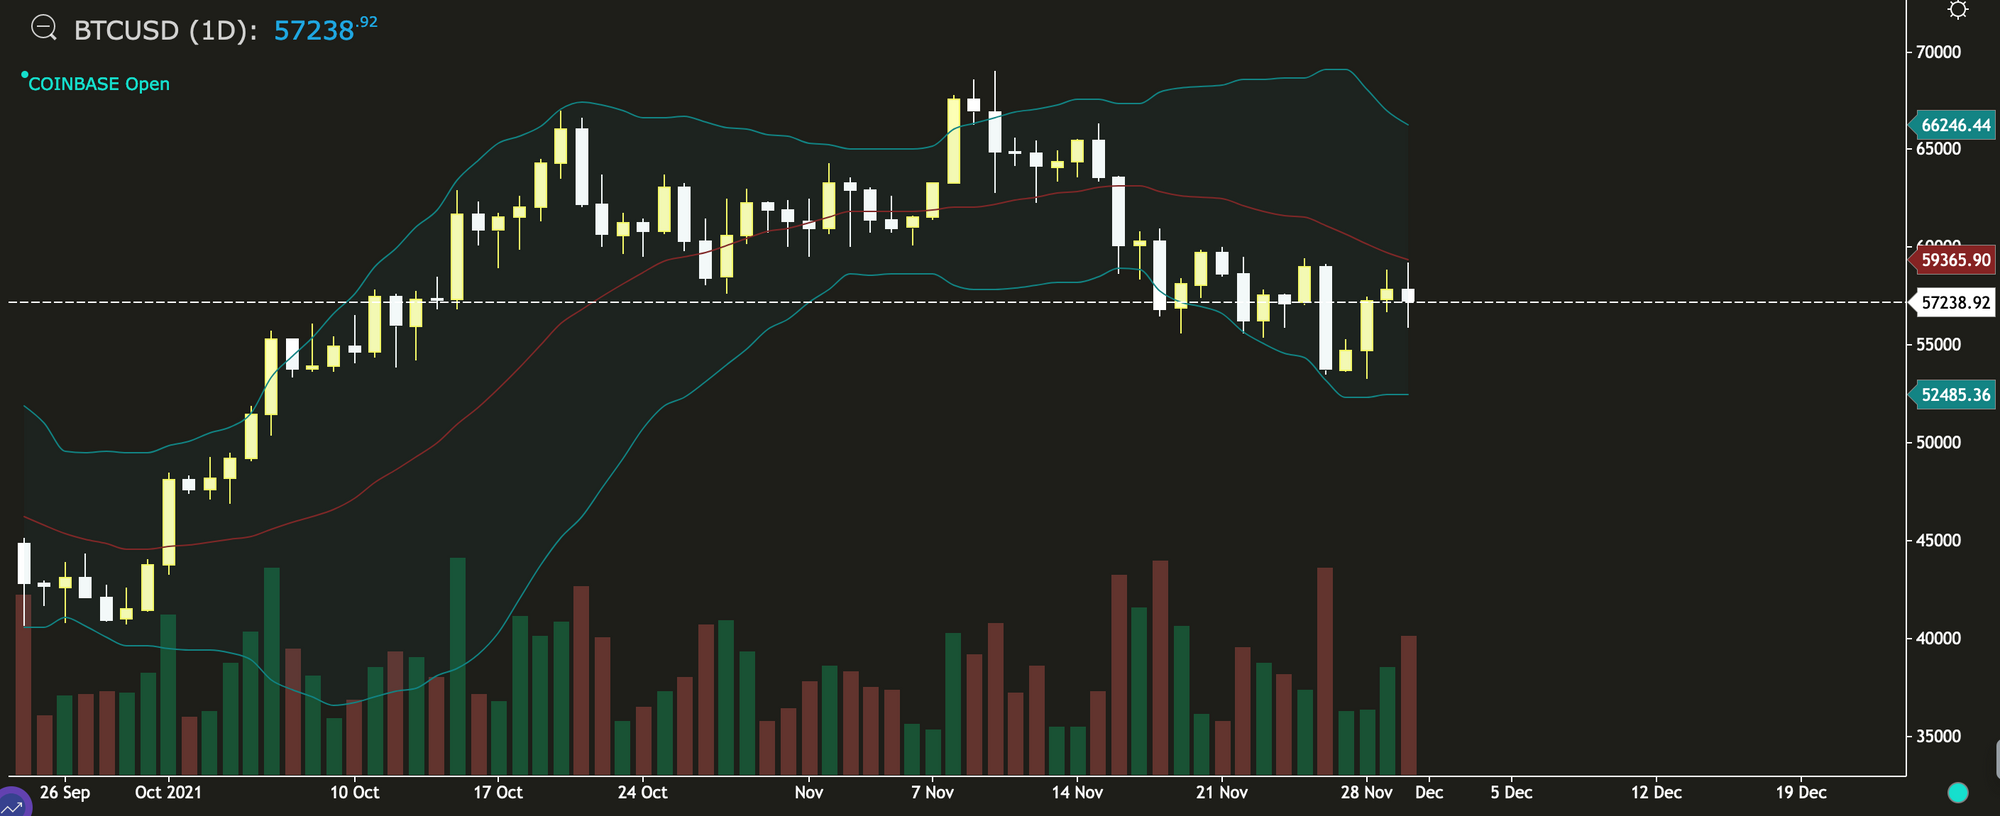
Looking at the daily chart below, we see that the price is near the lower Bollinger band and we'd like to see a daily close above the middle band (currently at $59,359) to see an attempt at $60,000 and a drive upwards. In the event of a downturn, the lower Bollinger band at $52,475 should provide support. There's a bearish engulfing pattern forming and a daily close below $57,318 could point to further weakness and a greater likelihood of testing the lower band at $52,475.
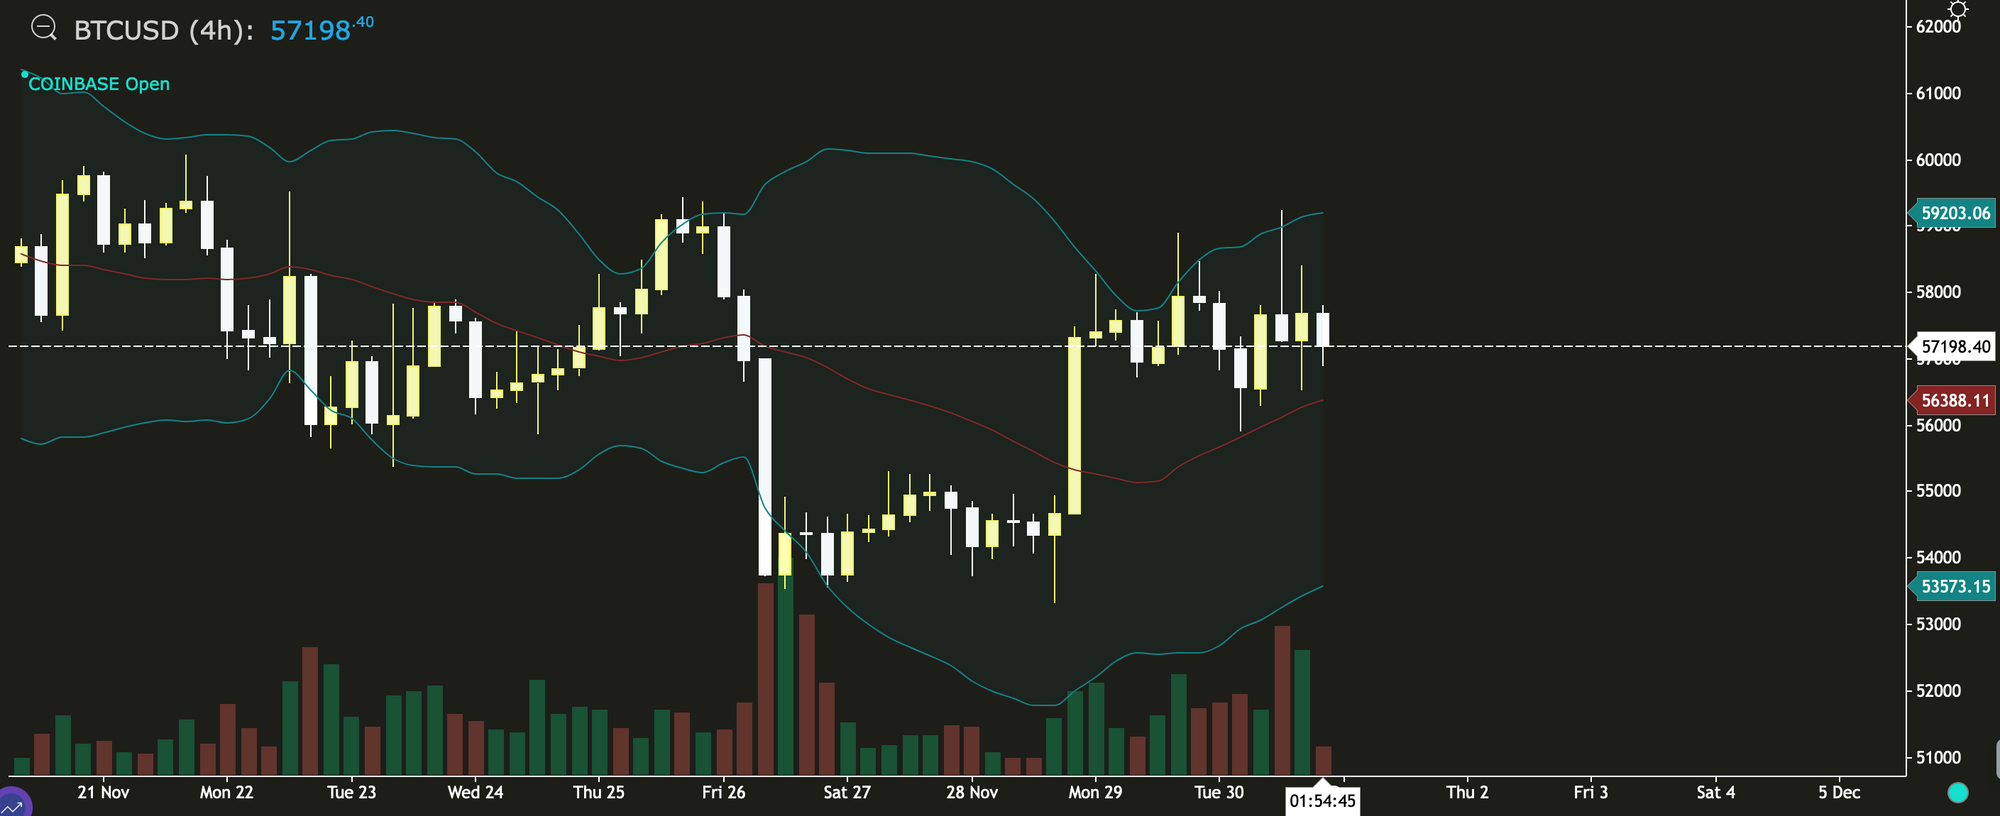
The 4-hour chart below shows that since closing above the middle Bollinger band during November 28th, this has provided an important support level with the price of Bitcoin bouncing from this level earlier this morning. Therefore, buyers could look to enter around $56,386. The upper band, just above $59,000, provides resistance and an opportunity to sell.
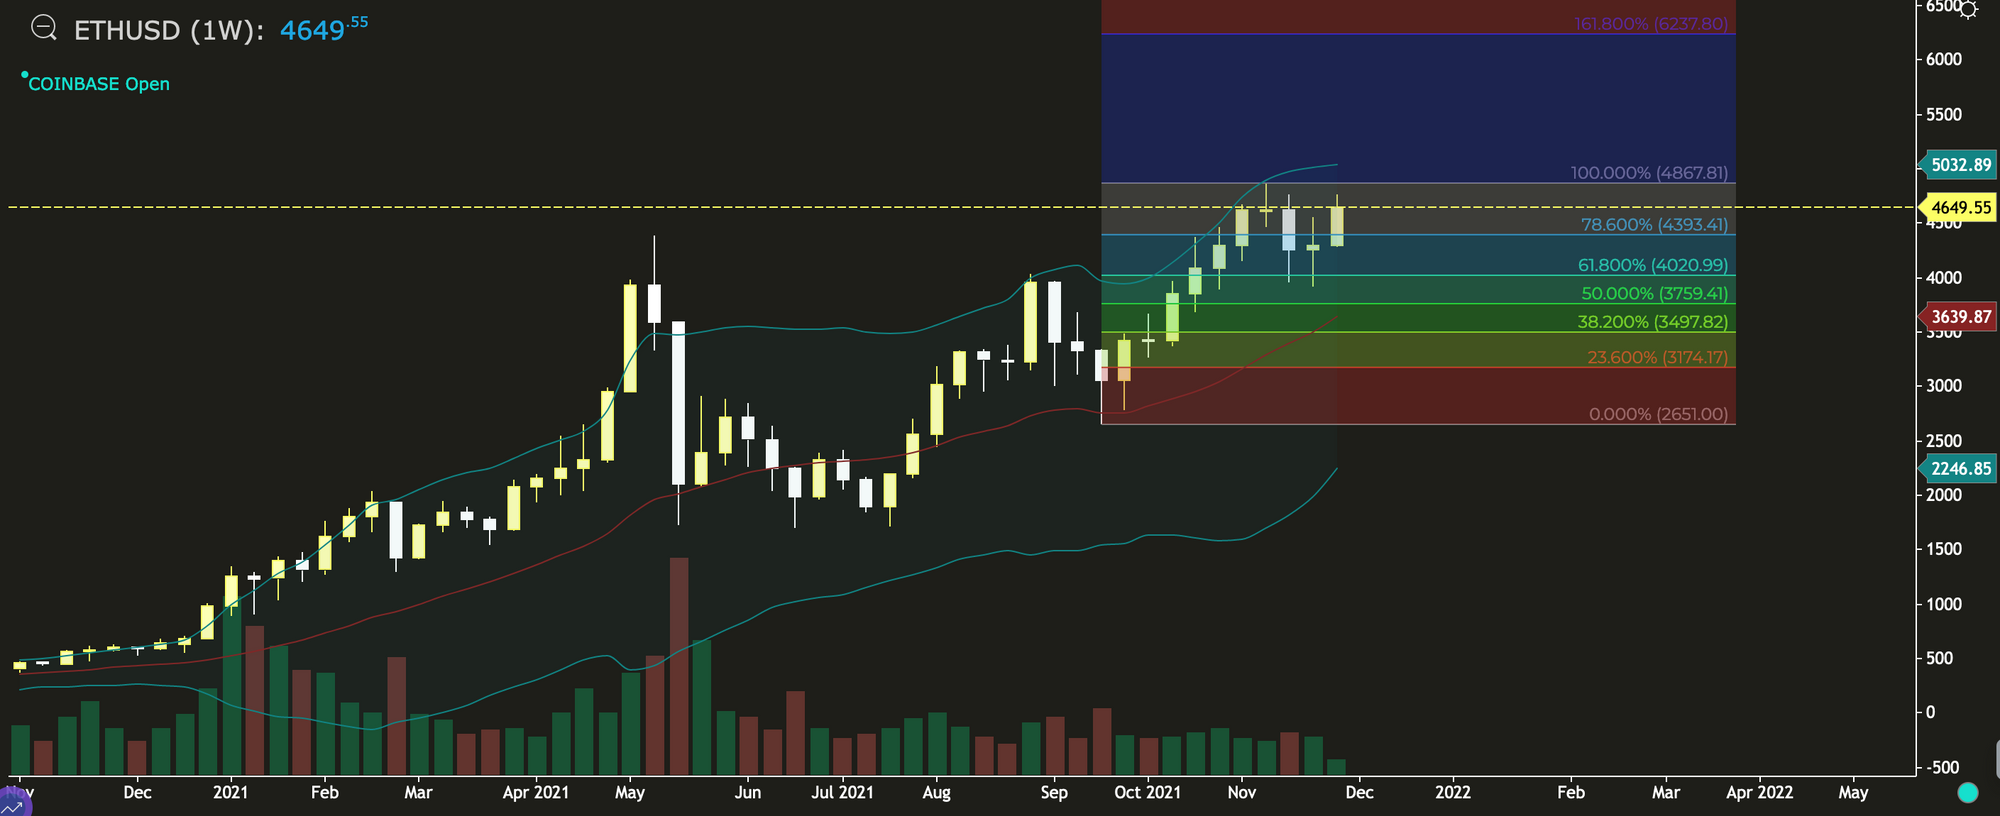
Looking at the weekly chart for ETH below, we see it is not that far away from the all-time high of ~$4,900 and a break of this level should see a move towards the Fibonacci extension level at $6,237. However, a rejection of $4,900 means we'll likely see a pullback towards the Fibonacci retracement level at $4,393.
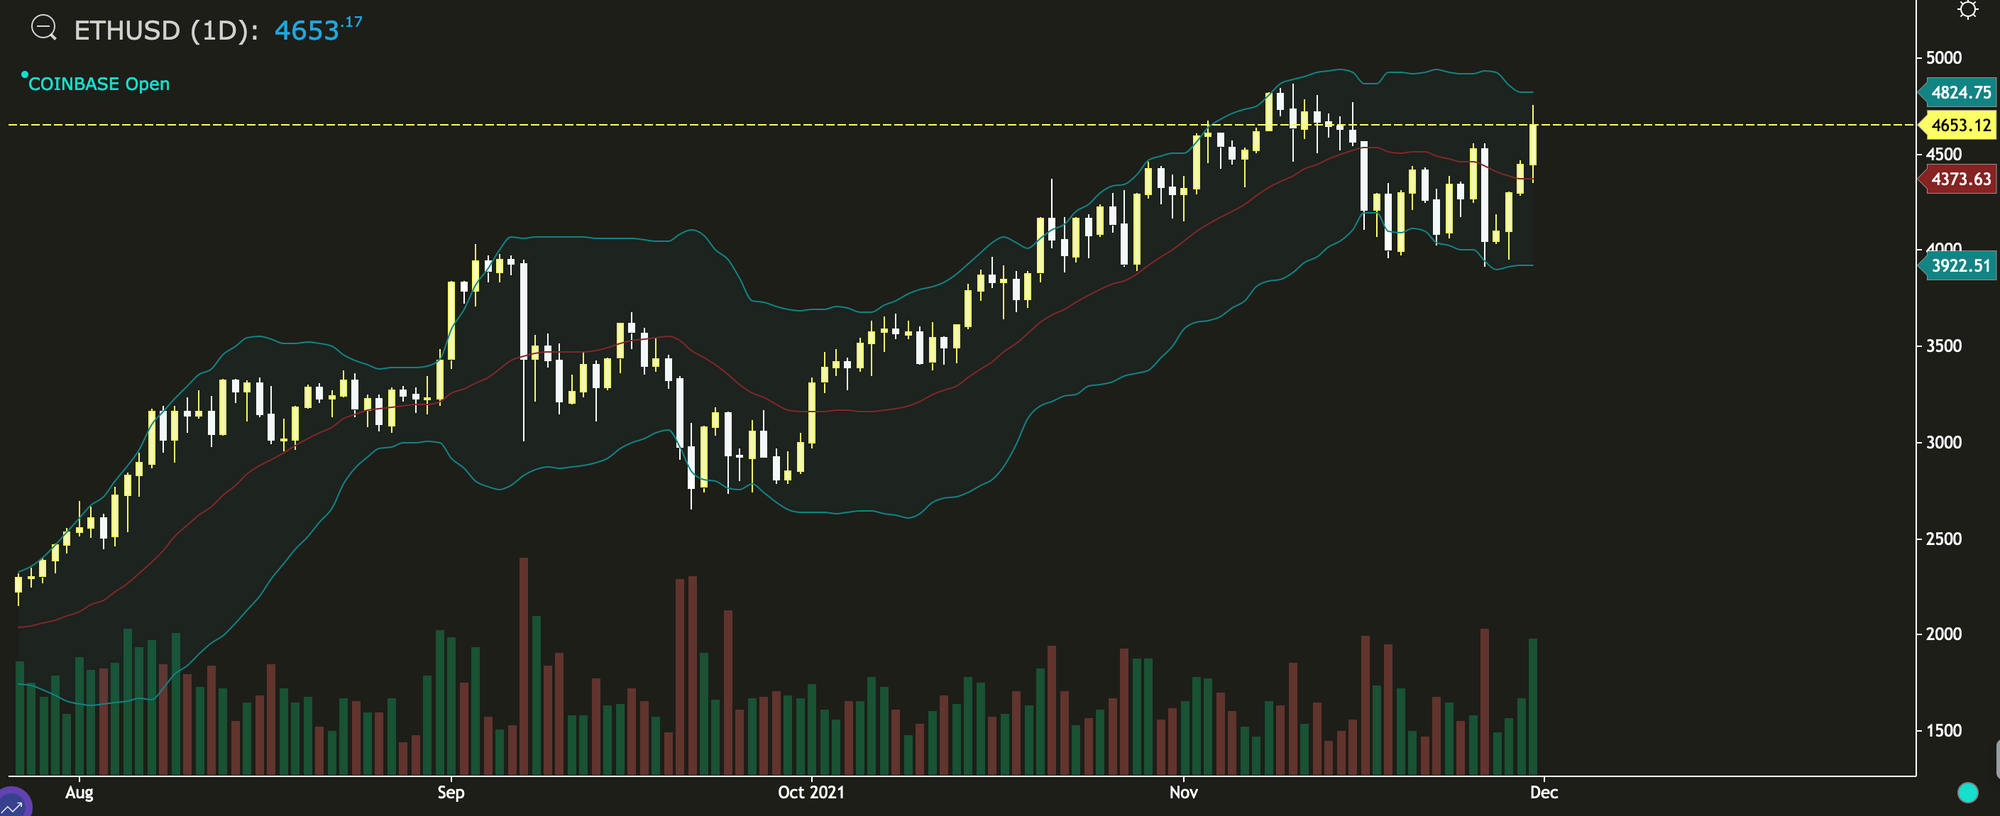
The daily chart shows ETH is experiencing the greatest buying volume in over two months. The price is nearing the upper Bollinger band at $4,824 which suggests that traders should exercise caution if they are trying to go long or have exposure to ETH, however, a daily close above the upper Bollinger band would point to a Bollinger squeeze and a greater likelihood of the upward trajectory continuing.
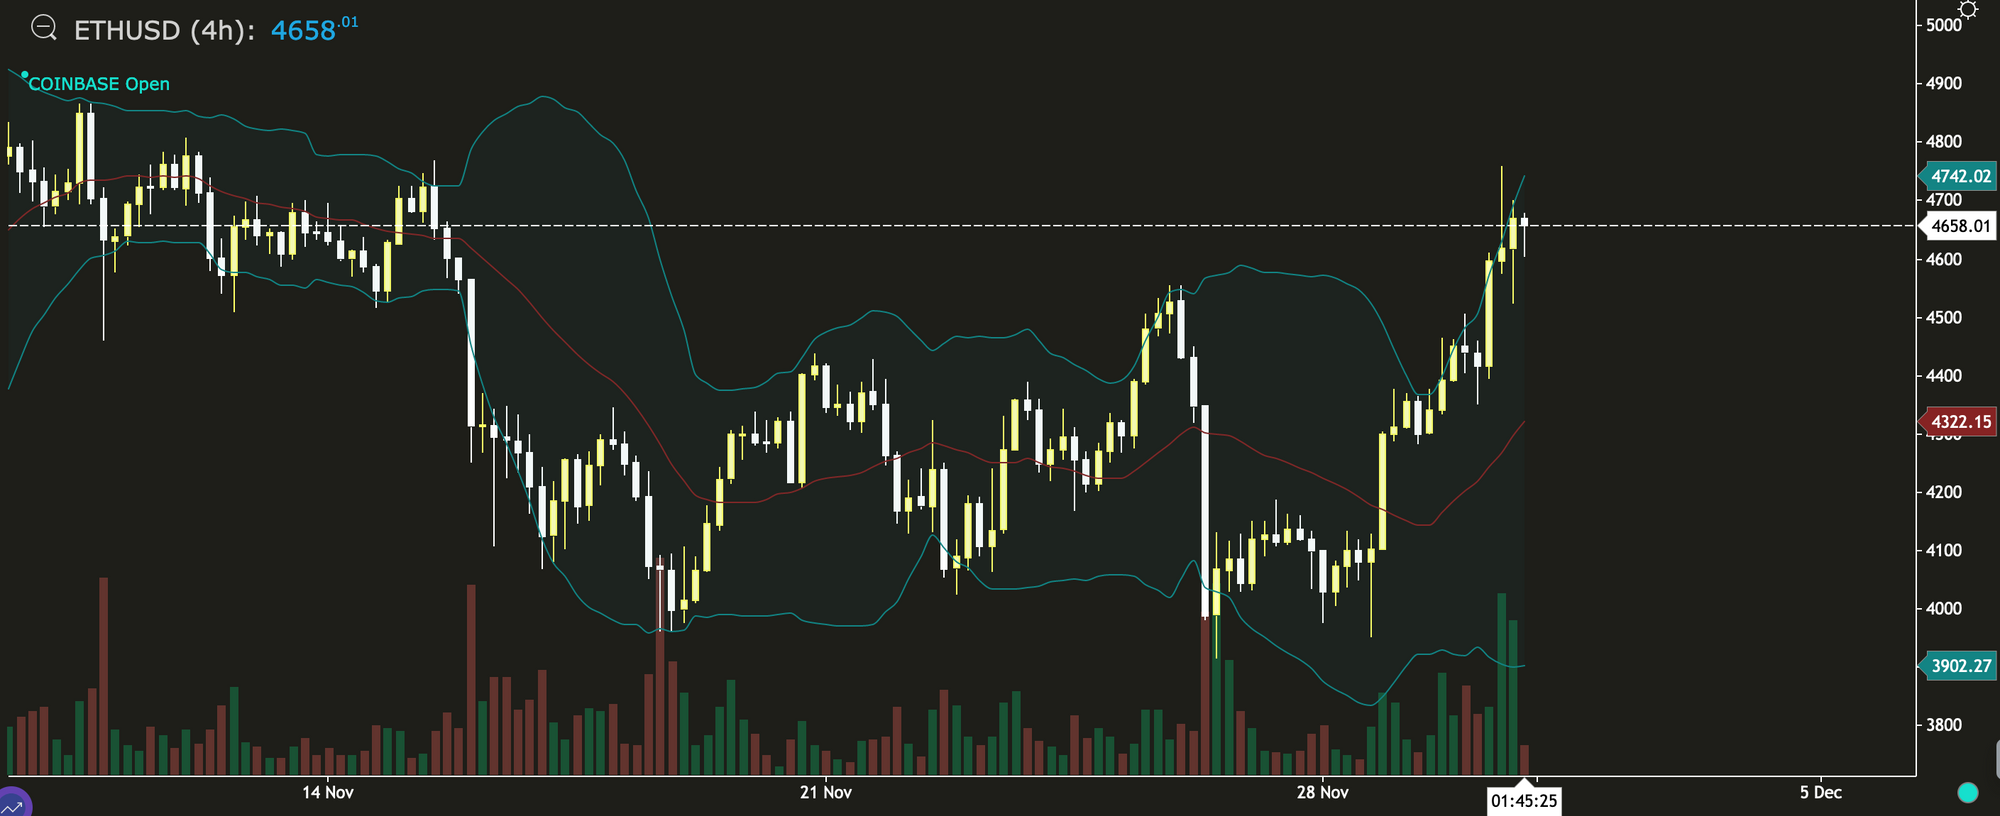
The 4-hour chart below for ETH shows that the price has been running up along the upper Bollinger band and the width of the bands is now at its highest since the beginning of October. This suggests that volatility may not last long and we are likely to see a test of the middle band, currently at $4,322.
Have a great week!
-The Rollbit team